
Examples of Simple Moving Average Crossover Rules to Test

Moving average crossover systems remain one of the simplest ways to test trend following behaviour, but they are often misunderstood. A crossover is not a prediction tool. It is a rule-based mechanism for identifying when price transitions from one regime to another. When you test them properly, they reveal how a market behaves when momentum builds, when it fails, and when volatility compresses.
To get meaningful results, you must treat moving averages as part of a structured model rather than isolated indicators. Below are detailed crossover frameworks that traders can test across Indian markets using minute, daily, or weekly data, depending on their objectives.
Start With a Defined Trend Hypothesis
Before writing rules, decide what trend you’re trying to measure. Trend following is not universal; medium-term index trends behave differently from intraday stock trends.
Examples of clear hypotheses:
- Capture medium-term legs on Nifty and Bank Nifty using daily closes.
- Trade short-term bursts on highly liquid F and O stocks using 30-minute bars.
- Identify long legs on weekly charts for positional trading.
Traders often begin by studying structured trend models on Stratzy. Since Stratzy visualises directional behaviour and major leg structures, it helps traders form clearer hypotheses before deciding which moving averages to test.
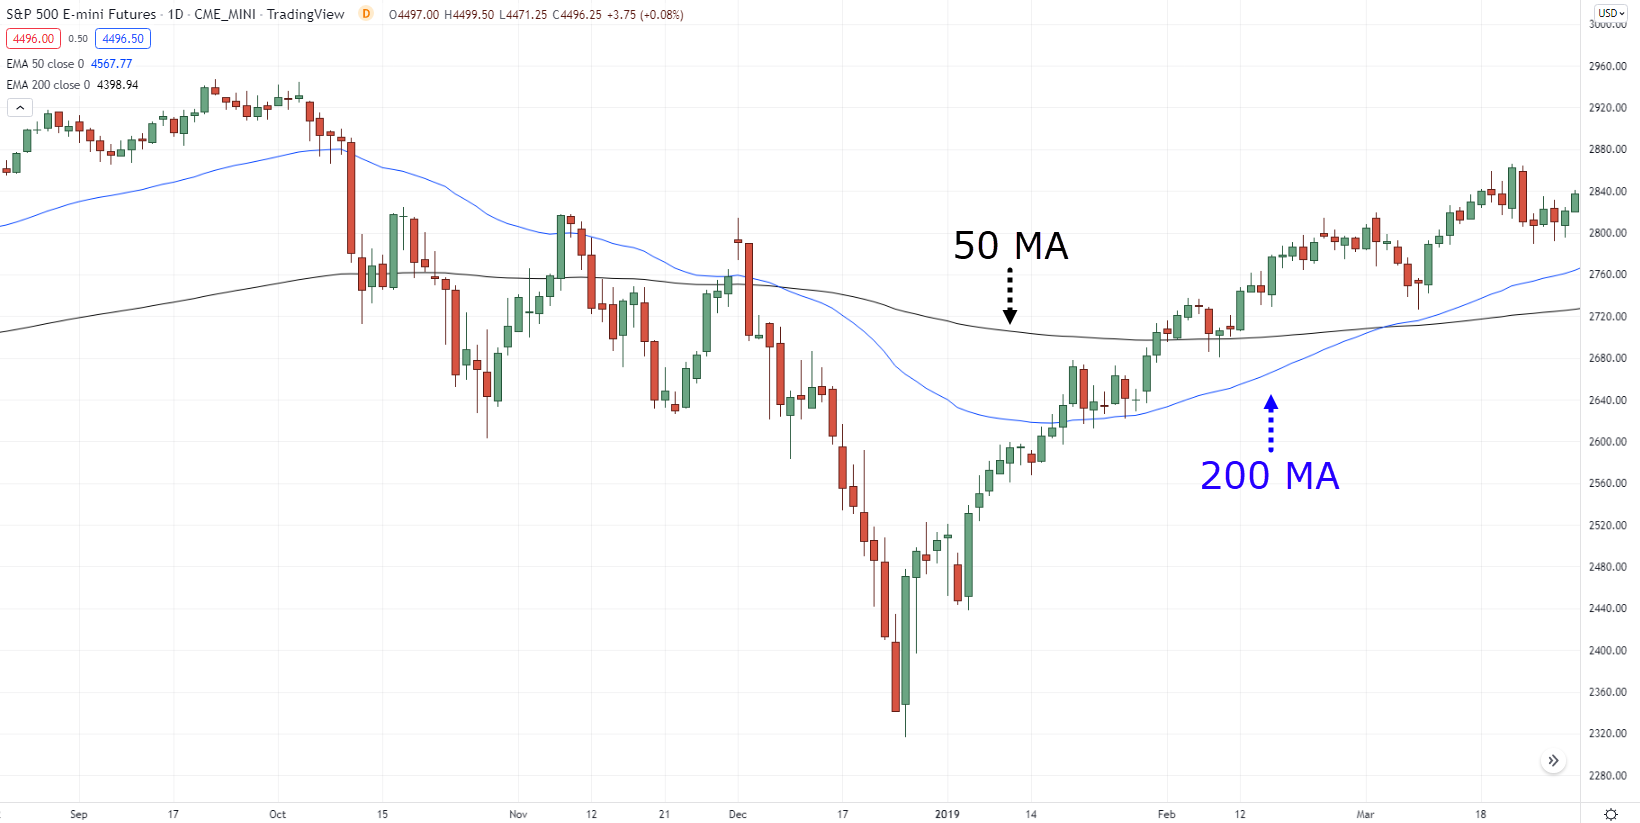
Classic 50 SMA / 200 SMA Crossover
This is the most researched crossover model and is commonly used as a baseline trend benchmark.
How It Works
- Trend definition: 200 SMA acts as a long-term structure filter.
- Momentum trigger: 50 SMA crossing above 200 SMA confirms momentum shifting upward.
Rules
Entry
- Long when 50 SMA crosses above 200 SMA.
- Short when 50 SMA crosses below 200 SMA.
Exit
- Reverse on opposite crossover.
- Optional safety exit: price closes below 50 SMA (for long trades) or above 50 SMA (for shorts).
What It Shows in Backtests
- Performs best on high-volatility trend phases.
- Suffers significant whipsaws in sideways ranges.
- Works better on daily and weekly data than intraday.
This system is reliable for measuring major trends but not short squeezes or micro-moves.
Fast EMA Crossover: 9 EMA / 21 EMA
A short-term trend reaction model used widely across intraday and swing systems.
Rules
Entry
- Long when 9 EMA crosses above 21 EMA.
- Short when 9 EMA crosses below 21 EMA.
Exit
- Opposite crossover.
- Optional ATR stop for volatility shocks.
Backtest Characteristics
- High sensitivity to noise.
- Effective during clean intraday legs and volatile openings.
- More slippage in stock futures due to spread dynamics.
Useful for traders who want frequency but must monitor execution accuracy closely.
Layered Trend Filter: 20 SMA / 50 SMA + 200 SMA Filter
Adding a trend filter removes trades taken against the broader structure.
Rules
Entry
- Only take long trades when price is above 200 SMA.
- Enter long when 20 SMA crosses above 50 SMA.
Exit
- Exit when 20 SMA crosses back below 50 SMA.
- Exit early if price closes below 200 SMA.
Why Test This
- Reduces whipsaws dramatically.
- Produces smoother equity curves.
- Better suited for daily charts of indices or liquid large-caps.
This model represents a structured positional trend system, not meant for fast intraday cycles.
Pullback-Based EMA Alignment: 10 EMA / 20 EMA Inside a 50 / 200 EMA Uptrend
This model enters inside trends instead of breakouts.
Rules
Trend definition
- 50 EMA above 200 EMA defines primary uptrend.
Entry
- Price pulls back under 10 EMA.
- Enter long when 10 EMA crosses back above 20 EMA.
Exit
- Close below 20 EMA or below 50 EMA for deeper trend breaks.
Backtest Behaviour
- Lower frequency.
- Better trade quality during stable trends.
- Underperforms during strong V-shaped reversals.
This structure is common in swing trading systems built on trend continuation.
Volatility-Adjusted EMA Crossover: 20 EMA / 50 EMA + ATR Filter
Adding volatility conditions eliminates weak signals.
Rules
Entry
- 20 EMA crosses above 50 EMA.
- ATR(14) above predefined threshold, for example ATR > 1.2 percent of price.
Exit
- Opposite crossover or ATR contraction below threshold.
Why It’s Useful
- Avoids low-volatility whipsaws.
- Performs better during high-energy market cycles like earnings seasons.
It simulates a more professional approach where signal quality matters more than frequency.
Price-Confirmed Breakout Crossover: 20 SMA / 50 SMA + 10-Day High Filter
This combines trend structure with breakout strength.
Rules
Entry
- 20 SMA crosses above 50 SMA.
- Price closes above the highest close of the last 10 days.
Exit
- Close below 20 SMA.
- Or opposite crossover.
Behaviour in Tests
- Later entries compared to pure crossovers.
- Higher average win size.
- Stronger filtering of weak momentum legs.
Useful on daily charts for trend followers who prefer confirmation.
How to Read Crossover Backtests Correctly
A moving average system is not judged by returns alone. The key interpretation points include:
- Maximum drawdown: Trend systems usually have deeper MDD due to long holding periods.
- Win rate vs payoff: Trend systems typically have win rates below 50 percent but higher average wins.
- Regime dependence: Results must be checked across trending and non-trending phases.
- Sensitivity: Small changes in MA lengths should not collapse performance.
A realistic crossover backtest should show small repeated losses and occasional large wins. Any system that removes losing streaks entirely is either biased or over-fitted.
How Stratzy Helps Before You Start Backtesting
With Stratzy’s organised models on Stratzy, traders gain clarity on how strategies behave in different conditions. That clarity makes algo trading smoother and more disciplined.