
How to Backtest a Trend Following Strategy Step by Step

Backtesting a trend following strategy is not just about throwing a moving average on a chart and checking how it looks. A proper test has a sequence. You define what you are trying to trade, write rules that a machine can understand, run them on clean data, and then stress check the results. If any of these parts are shallow, the final outcome is unreliable, no matter how good the equity curve appears.
This walkthrough breaks the process into clear steps, using logic that you can implement on TradingView, Python, Amibroker, or any other engine that supports rule based testing.
Start With a Clear Trend Idea, Not Just an Indicator
Most failed backtests start from the wrong place. They begin with an indicator, not an idea. For trend following, the core idea is simple, stay with markets that move in one direction for a while and get out when that structure breaks.
You should be able to describe your idea in one or two sentences. For example:
- Ride medium term trends on Nifty and Bank Nifty using daily data
- Trade short term trends on liquid stocks using 30 minute charts
- Catch major trend legs on index futures with weekly data
If you cannot state this cleanly, the backtest will be fuzzy.
A lot of traders use a tool like Stratzy at this point. Instead of staring at a blank chart, they look at structured trend setups and directional models, then use those as the base idea. You still have to do your own rules and testing, but at least the starting point is organised rather than random.
Step 1: Define the Universe and Timeframe
Instruments
Decide exactly what you will test:
- Index futures only, for example Nifty, Bank Nifty
- Large cap stocks
- A fixed basket of liquid F and O names
The more focused the universe, the easier it is to read the results.
Timeframe
Trend following behaves very differently on daily charts compared to 5 minute charts. Pick one:
- Daily or weekly for positional trend following
- 15 or 30 minute if you are interested in intraday trend legs
Do not mix timeframes in the first test. Keep it simple, then expand later.
Step 2: Turn “Trend” Into Hard Rules
Trend following needs unambiguous rules for three things: trend definition, entry, and exit.
Define the trend
Pick one primary method, for example:
- Price above 200 day SMA means uptrend, below means downtrend
- 50 EMA above 200 EMA means uptrend, below means downtrend
- Supertrend in buy mode means uptrend, sell mode means downtrend
The key is, the engine should be able to check the condition with no interpretation.
Entry rules
Once trend direction is defined, decide how you will enter:
- Enter long when price closes above 20 day high while in an uptrend
- Enter short when price closes below 20 day low while in a downtrend
- Or, enter on pullbacks, for example price back to 20 EMA inside an uptrend
You want something that reacts to the trend but does not chase every candle.
Exit rules
Trend followers usually use one or both:
- A volatility based stop, for example 2 times ATR below the highest close in an uptrend
- A trend break rule, for example price closing below 50 EMA or below previous swing low
Set this clearly before you write any code.
Step 3: Choose Data and Prepare It Correctly
Clean data matters more than indicator choice.
- Use continuous data for futures, back adjusted so contract rollover does not create fake gaps
- Apply split and bonus adjustments for cash equities
- Make sure timestamps are consistent and there are no missing chunks of historical data
If you are testing on Indian markets, at least five to ten years of daily data is a sensible minimum for positional systems. For intraday, a couple of years of 15 or 30 minute data is a better benchmark than a few months.
Step 4: Code the Strategy Carefully
Now translate the rules into code in your chosen environment.
- Define trend filter first
- Add entry logic on top of that filter
- Add exits, both stop loss and trend break
- Include basic position sizing, for example a fixed fractional risk per trade
Check the logic on a small visible slice of data. Walk through a few trades manually to make sure the code is doing what you think it is doing. One bar of look ahead or a misaligned index can completely distort the results.
Step 5: Add Realistic Costs and Slippage
A trend following strategy often holds positions for days or weeks, but that does not mean costs are trivial.
Include:
- Brokerage and exchange charges
- STT and taxes as per current schedule
- A small slippage assumption per trade, even for daily systems
If you test intraday trends, slippage and spread will hit much harder, especially in stock futures and illiquid names. Do not skip this step. A system that survives after realistic costs is far more trustworthy than one that needs perfect fills to look good.
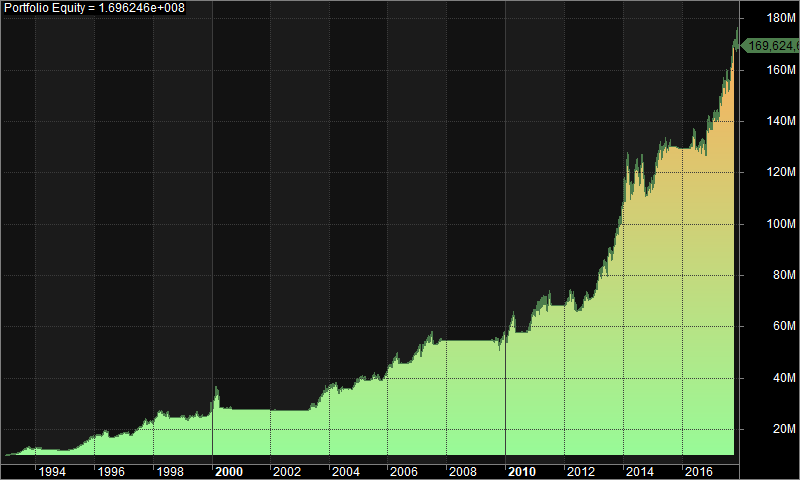
Step 6: Run the Backtest and Read Beyond the Equity Curve
Once the engine runs the full historical test, resist the urge to look only at final profit or CAGR.
Key outputs to inspect:
- Maximum drawdown and how long recovery takes
- Win rate and average win versus average loss
- How often trades come, you do not want a “nice” system that trades twice a year
- Year wise or month wise return breakdown to see if performance is concentrated in a few periods
Trend following typically shows a pattern of many small losses and a handful of large wins. If the backtest shows almost no losing streaks or suspiciously smooth equity growth, it likely has hidden bias.
Step 7: Run Basic Robustness Checks
A single backtest run on one set of parameters is not enough.
Simple robustness checks include:
- Shifting moving average lengths slightly, for example 50 to 45 or 55, and checking if performance stays within a sensible band
- Testing on a nearby timeframe, for example 20 day breakout idea on weekly rather than daily
- Applying the same logic to a different but related instrument, for example from Nifty to Bank Nifty
You are not looking for the best possible combination; you are looking for behaviour that does not collapse when conditions change a little.
Where Stratzy Fits in This Step by Step Process
With Stratzy’s organised models on Stratzy, traders gain clarity on how strategies behave in different conditions. That clarity makes algo trading smoother and more disciplined.